
Jump to Topic
• IMMIGRANTS • EMPLOYMENT EQUITY • FOREIGN STUDENTS • REFUGEES/ ASYLUM SEEKERS
• CENSUS METROPOLITAN AREAS • MISCELLANEOUS • VISAS ISSUED
TEMPORARY FOREIGN WORKERS
- Complete List of Employers of Temporary Foreign Workers 2013 to 2015 (816 pages)
- Number of Temporary Foreign Workers Admitted 2014 to 2016
- Temporary Foreign Workers Present In Canada, 2006-2010
- The Top 20 Employers Using the Temporary Foreign Worker Program, Jan. 1, 2011 to Dec. 31, 2011
- The Top 200 Employers Using the Temporary Foreign Worker Program in 2011
- The Names of 20 Well-Known Fast Food Restaurants, Box Stores and Hotels Which Used the Temporary Foreign worker Program in 2011
- Tim Horton’s Use of Temporary Foreign Workers from Jan. 1, 2007 to August 31, 2012 Plus Countries of Origin of These Workers
- Canada’s Official Immigration Levels Plan 2020-2022
- Immigration, Refugees, and Citizenship Canada Overview Sept. 30, 2016
- Settlement Services and Provinces In Which Immigrants Received Those Services (April 2015 to Nov. 2016)
- Number of Canadian Citizenship Applications Processed (2015 +)
- Number of Permanent Resident Cards Issued (2015 and 2016)
- Number of Permanent Residents Admitted Who Held Prior Study Permits 2006 to 2016
- Number of Permanent Residents Admitted Through Express Entry Programme By Gender and Province / Territory, 2015 to November 2016
- Number of Regular and Renewal Passports Issued (2016–2017)
- 2017 Immigration Levels Plan
- Canadian Immigration Levels 2016
- Immigration Levels for 2015
- Table Showing Breakdown of Immigrant (Permanent Resident) Admissions from 2002 to 2012
- Table Showing Proportion of Annual Immigration to Canada’s Population, 1860 to 2011
- Interprovincial Mobility of Immigrants In Canada, 1991–2006
- International and Interprovincial Migration to and from Quebec, 1986–2012
- Breakdown and Description of 2013 Immigration Programs
- Graph Showing By Category Number Of Immigrants (Permanent Residents) Who Came To Canada from 1980 to 2005
- Source Countries of Immigrants to Canada from 2004 to 2013
- Top 16 Countries of Origin of Immigrants to Canada 1998 to 2007
- All Countries of Origin of Immigrants to Canada–2001-2010
- Canada – Permanent residents by top 10 source countries, 2008–2010
- Immigrants To Canada–1999-2008—Breakdown By Numbers Of Each Group (4 Groups : Family, Economic, Refugees, Other) Of Immigrants
- Number and share of the foreign-born population in Canada, 1901 to 2006
- Distribution of Public Service of Canada Employees by Designated Group According to Department or Agency (Mar 31, 2014)
- Distribution of Public Service of Canada Employees by Designated Group and Region of Work (Mar 31, 2014)
- Distribution of Public Service of Canada Employees by Designated Group and Occupational Category (Mar 31, 2014)
- Distribution of Public Service of Canada Employees by Designated Group and Salary Range (Mar 31, 2014)
- Hirings, Promotions Into the Public Service of Canada by Designated Group and Separations From the Public Service of Canada by Designated Group (Mar 31, 2014)
- —————————————————————————–
- Distribution of Public Service of Canada Employees by Designated Group According to Department or Agency (Mar 31, 2011)
- Distribution of Public Service of Canada Employees by Designated Group and Region of Work (Mar 31, 2011)
- Distribution of Public Service of Canada Employees by Designated Group According to Occupational Group (Mar 31, 2011)
- Distribution of Public Service of Canada Employees by Designated Group and Salary Range (Mar 31, 2011)
- Hirings, Promotions Into the Public Service of Canada by Designated Group and Separations From the Public Service of Canada by Designated Group (Mar 31, 2011)
- Distribution of Public Service of Canada Employees by Designated Group and Age Range (Mar 31, 2011)
- International Students and the source countries of those students — 2013, 2014 and 2015
- Countries of Origin of International Students in Canada
- Total Entries of Foreign Students By Source Country In Only The Year 2012
- Total of Foreign Students Present In Canada on Dec. 1, 2012 by Source Country
- Total of Foreign Students Present In Canada on December 1, 2011 by Source Country (CIC Immigration Overview, Pp. 83 – 85)
- Total Entries Of Foreign Students Each Year Between 2006–2010
- Syrian Refugees Admitted By Province and Territory, Gender, Age Group, Immigration Category from Nov 4, 2015 to Nov 20, 2016
- Refugees Top 10 Source Countries 2011-2016
- Social Assistance Receipt Among Refugee Claimants in Canada
- CIC Immigration overview Page 102, Total entries of refugee claimants by top source countries 2002 to 2011—Number and Percentage Distribution from each source country
- Immigration overview, Page 96 Total entries of humanitarian population by province or territory and urban area from 2002 to 2011
- Resettlement to Canada since 1979
- Acceptance Rates Of Refugee Claimants In 2003
- Asylum Claims Received at Canadian Land Borders & Airports
- Vancouver CMA—2006 Census—Location Of South Asian Population
- Vancouver CMA—2006 Census—Location Of Chinese Population
- Toronto CMA—2006 Census—Location Of South Asian Population
- Toronto CMA—2006 Census—Location Of Chinese Population
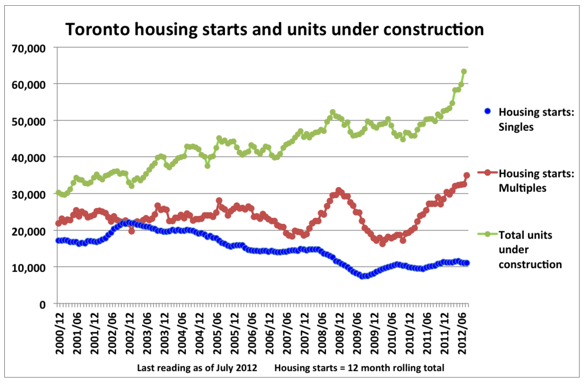
- Toronto Housing Starts and Units Under Construction from 2000 to 2012
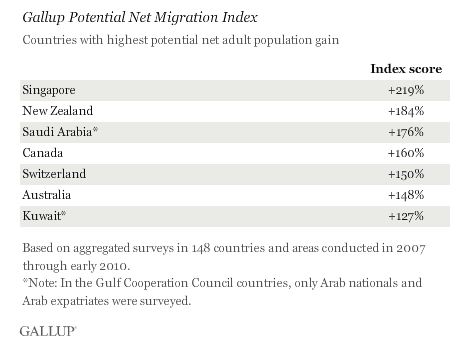
- Graph showing countries with highest potential net adult migration gain
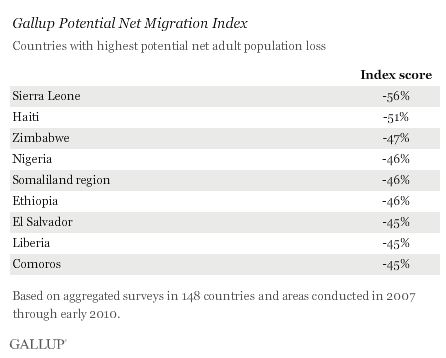
- Graph showing countries with highest potential net adult migration loss
- Aging – Dependency Ratio for Various Levels of Immigration
- World Food Land Map
- The Environment and the Economy
- The Economic Impact of Population Growth
VISAS ISSUED

